Now when you have CollectD and InfluxDB installed you may configure Grafana 😃
First configure repo with current Grafana version (select your distro):
curl https://packagecloud.io/gpg.key | sudo apt-key add -
deb https://packagecloud.io/grafana/testing/debian/ wheezy main
Now install package (on wheezy I needed to install apt-transport-https to allow installation of packages from repo via HTTPS):
apt-get update
apt-get install -y apt-transport-https
apt-get install -y grafana
By default Grafana will use sqlite database to keep information about users, etc:
[database]
# Either "mysql", "postgres" or "sqlite3", it's your choice
;type = sqlite3
;host = 127.0.0.1:3306
;name = grafana
;user = root
;password =
If that’s ok for you, you may leave it as is. I prefer to configure MySQL database (create user, database, grant permissions to user):
[database]
type = mysql
host = 127.0.0.1:3306
name = grafana
user = grafana
password = mydbpassword
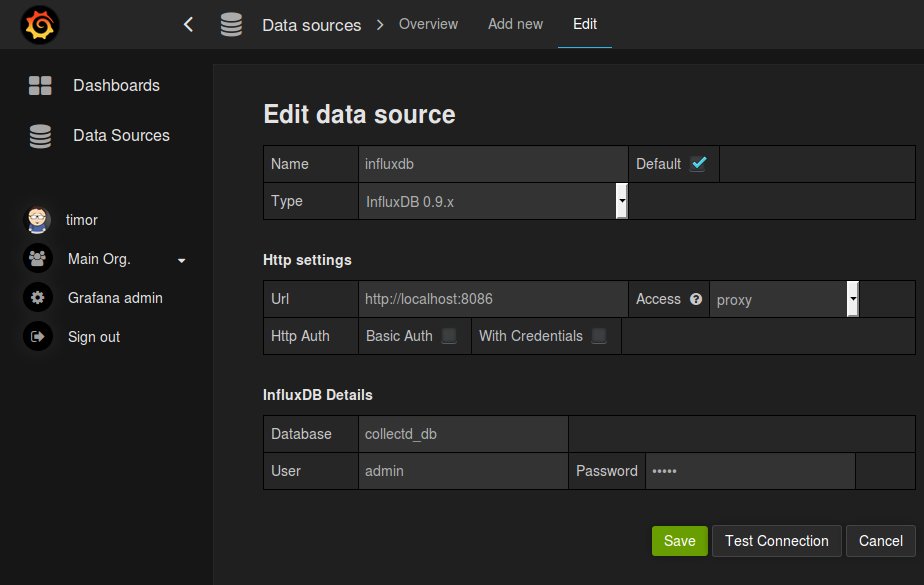
So Grafana should be running on port 3000 by default, now it’s time to connect ex.: http://localhost:3000 (use your host). Now click Data sources on left panel, then Add new on top panel and fill source data like below:

Because we didn’t set authorization for InfluxDB you may just type whatever login/password there. Now Test Connection and Save and you should be ready to play with Grafana.
I also used scripted dashboard for Grafana to add easily statistics for my hosts, you may find it here: https://github.com/anryko/grafana-influx-dashboard
](https://gagor.pro/generic-cover.webp)